
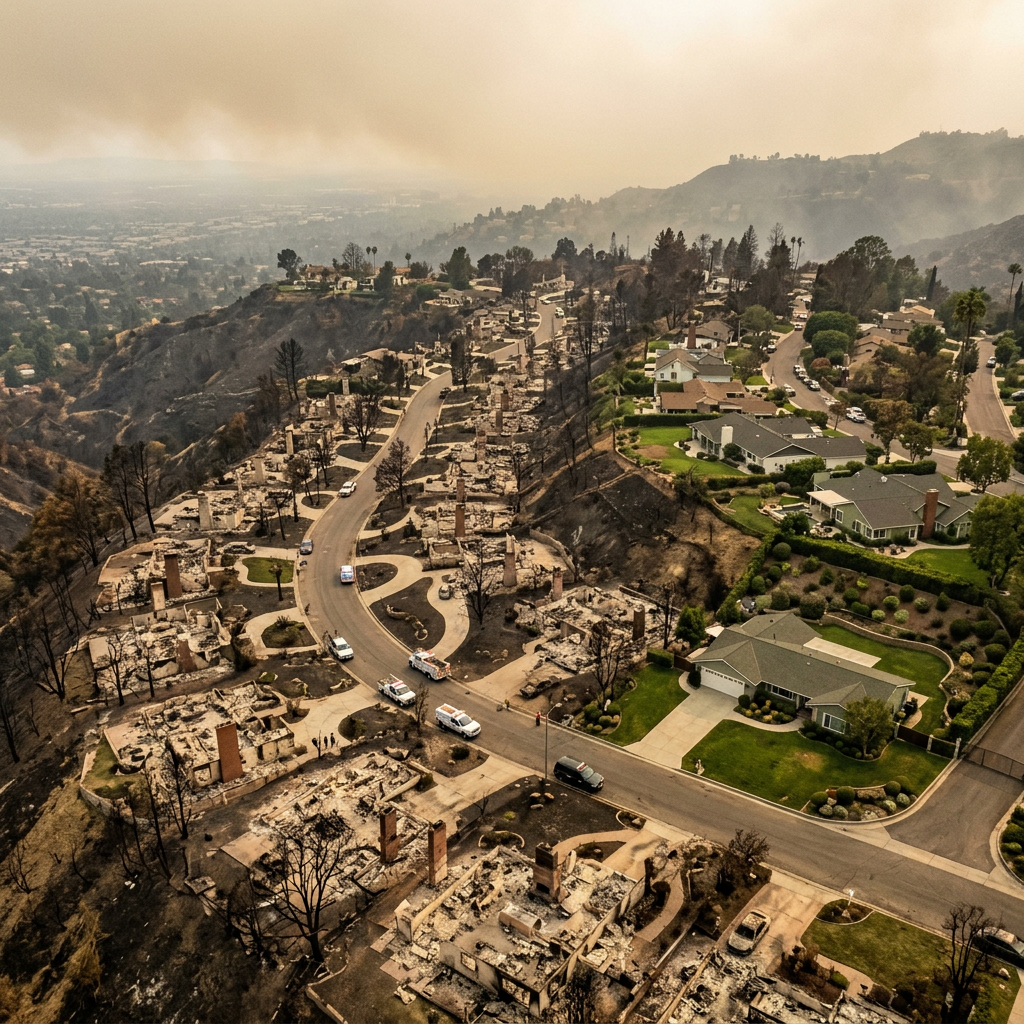

On January 7, 2025, two fires erupted on opposite ends of Los Angeles County within hours of each other. Driven by Santa Ana winds gusting at 90 mph, the Palisades and Eaton fires grew from small brush fires to 59 square miles of destruction in less than 48 hours. When the smoke cleared: 16,246 structures destroyed, 31 lives lost, and $33.9 billion in federal disaster aid requested.

What the Numbers Actually Mean
The 2025 LA fires weren't just the costliest in California history. They were a controlled experiment at scale — two fires burning through residential neighborhoods of comparable construction, comparable building codes, and comparable pre-fire preparation. The variable that determined outcomes was protection type.
2025 LA Fires: The Full Scale
16,246
Structures Destroyed
9,413 Eaton · 6,833 Palisades
31
Lives Lost
19 Eaton · 12 Palisades
59 mi²
Total Area Burned
≈ size of San Francisco
Source: Cal Fire; PBS/AP; UCLA Lewis Center
The Speed That Broke All Models
What distinguished the 2025 fires from previous California fire seasons was the speed. The sequence of escalation was measured in hours, not days.
This is the reality that fire models didn't account for: simultaneous ignitions under extreme wind. When fire resources are split across two fronts, individual properties are on their own for hours. The properties that survived had protection systems that operated autonomously.
Why Standard Measures Failed
Most destroyed properties had implemented standard defensible space: cleared vegetation, metal gutters, fire-resistant roofing. Insurance companies had rated these homes as "improved risk." Fire marshals had signed off. Owners had done everything conventional wisdom suggested.
They still burned.
The 2018 Camp Fire in Paradise, California, had already demonstrated this at a smaller scale — 18,804 structures destroyed despite widespread code compliance. The 2025 fires simply confirmed it at a scale too large to rationalize away.
Why Code-Compliant Homes Burned
❌
Defensible space couldn't stop airborne embers
Embers traveled miles ahead of flame fronts at 90 mph wind speeds
❌
Fire-resistant roofing couldn't resist sustained radiant heat
When neighbouring structures ignited, radiant heat overwhelmed materials
❌
Fire crews couldn't reach most properties
Two simultaneous fires stretched resources beyond capacity for hours
What the Post-Fire Analysis Revealed
When researchers examined properties threatened by the same fires, in the same neighbourhoods, with identical building codes, the pattern became undeniable: homes with engineered active protection systems survived at rates 5-10 times higher than unprotected properties.
This isn't marginal difference. This is fundamental.
The Rebuilding Crisis
One year after the fires, only 10 houses have been rebuilt across the entire fire zone, according to city and county data. Just 10. Out of 16,246 destroyed structures. Hundreds more are under construction, but for thousands of homeowners, the displacement continues.
The charitable response was extraordinary — between $860 million and $970 million raised, including $265 million through GoFundMe alone. But charity doesn't rebuild neighborhoods. Insurance proceeds at 60-70% of replacement value, combined with construction costs that have increased 68% since 2019, means most homeowners face a gap measured in hundreds of thousands of dollars.
What This Means for Every Property Owner
The 2025 LA fires eliminated theoretical debate. They provided definitive real-world evidence at a scale that can't be dismissed as anecdotal. The lesson applies everywhere wildfire risk exists: California, British Columbia, Alberta, Ontario, Australia.
The Lesson Is Clear
Passive measures are valuable groundwork.
Active defence determines survival.
The cost of prevention is measured in thousands.
The cost of rebuilding is measured in years.