

Homes don't burn from flames. They ignite from embers.
The way wildfire actually takes a structure is well documented — and it isn't what most homeowners picture. Five minutes here will change how you see your own property.
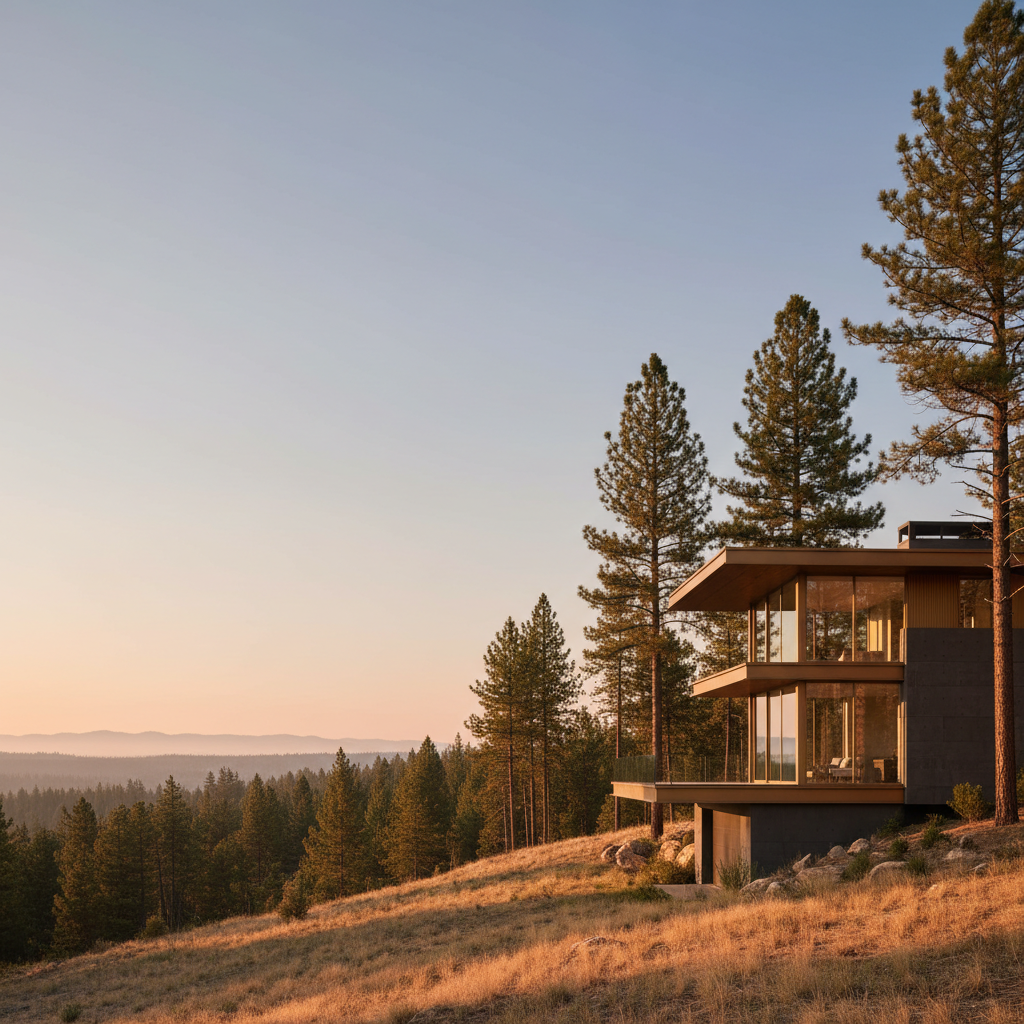
The fire is 20 km away. The embers are already here.
A fire map shows you the front. It cannot show you the ember stream landing on your roof an hour earlier — which is how roughly nine in ten lost homes actually ignite.
How a structure is actually lost.
Four stages, in order — and why purely passive measures stop working at stage two.
- 01
Conditions align
Heat, drought, and wind turn the landscape into fuel. Fire weather days are increasing on three continents — longer seasons, drier fuels, faster spread.
Risk is now seasonal certainty, not rare event.
- 02
Embers arrive first
Wind carries burning embers kilometres ahead of the front. They land in gutters, against decks, into vents — dozens at a time, long before any flame is visible from the property.
The attack begins while crews are still elsewhere.
- 03
Small ignitions take hold
A single ember in dry debris is enough. Most homes are lost to multiple small ignitions that smoulder unattended — not to a wall of flame.
Passive measures reduce odds; they cannot intervene.
- 04
Radiant heat finishes it
As the front nears, radiant heat alone ignites dry surfaces without contact. A structure that is saturated absorbs and disperses that energy instead of reaching ignition threshold.
Only active saturation defends through the whole event.
Six places embers look for a way in.
Explore each exposure point — what makes it vulnerable, what the free assessment checks, and how an engineered system defends it.
Roofline & gutters
Dry needles and leaf litter in gutters are the #1 ember catch-point. One ember in debris ignites at the most connected edge of the structure.
- The assessment checks
- Roof material, gutter exposure, and debris-trap geometry.
- How the system defends
- Roofline nozzles saturate the gutter line first — the highest-probability ignition point.
Wildfire statistics — USA, Canada & Australia.
The same pattern on three continents: longer seasons, ember-driven losses, and structures lost before crews can reach them.
of homes lost ignite from embers, not flames
structures destroyed in the 2025 LA fires
insured wildfire losses, Canada 2024
homes destroyed in Australia's Black Summer, 2019–20
Figures drawn from official incident and loss reporting: CAL FIRE incident data, the Insurance Bureau of Canada, and Australia's Royal Commission into National Natural Disaster Arrangements (Black Summer, 2019–20).
Three continents. Three fire seasons.
Prodigy engineers and installs on all three — with live fire intelligence for each.
Canada
Fire season: May – September2023 and 2024 were the two most destructive wildfire seasons in Canadian record — over $9B in insured losses in 2024 alone.
United States
Fire season: June – October · year-round in CaliforniaThe January 2025 Los Angeles fires destroyed 16,000+ structures — in mid-winter, driven almost entirely by wind-borne embers.
Australia
Fire season: November – MarchBlack Summer (2019–20) burned 24+ million hectares and 3,000+ homes — most lost to ember attack ahead of the fire front.
“General risk is a statistic. Your risk is an address — terrain, fuels, fire history, and six exposure points that can be checked in two minutes.”
See your address through an ember's eyes.
The free assessment maps everything on this page onto your actual property — terrain, vegetation, fire history, and all six exposure points.